
- Benchmarks
Voice agent latency: measure speech to playback time
Voice agent latency needs a caller-side clock. Build a reproducible benchmark for endpointing, models, tools, and audible responses.
- Author
 Udit Goenka
- Published
- Reading time
- 24 min
TL;DR: Measure voice agent latency from the caller's last speech sample to the first response sample played on the caller's device. Keep endpointing, model, tool, synthesis, transport, and playback timings as separate evidence, and report failures alongside percentiles.
A server can generate audio quickly while a caller still hears a long pause. Audio waiting inside a queue, a media gateway, or a playback buffer belongs to that caller's experience even when every provider dashboard reports a healthy request.
A useful voice agent latency benchmark starts with an explicit observation boundary. It ends with a dataset that another engineer can interpret without guessing which clock, speech detector, or response definition produced the number.
As of November 9, 2026, LiveKit's data hooks expose per-turn metrics and component measurements, while Twilio's Media Streams protocol distinguishes media from playback-related mark messages. These are useful instrumentation surfaces, but neither removes the need to define what your benchmark means by a response.
60db's June 2026 TTS report reports about 197 ms median from final text submission to first received audio bytes on a warm connection, using a 330-prompt Hindi and English corpus. That is a synthesis-stage result; the report does not establish end-of-speech-to-playback latency, and it does not disclose hardware, concurrency, or per-language run counts.
This guide describes a measurement design, with illustrative calculations and a small local validator. It does not publish a measured ranking of providers or claim a measured end-to-end result for 60db Agent.
Table of contents
- Define the measurement contract
- Separate clock domains and response boundaries
- Instrument a turn without inventing precision
- Build a corpus that represents the workload
- Calculate distributions and count failures
- Find the critical path before optimizing
- Run comparisons and release decisions
- Frequently asked questions
- Build a benchmark you can defend
Define the measurement contract
Voice agent latency is a duration between two named events, measured within a stated clock domain. The phrase alone does not identify either event, so a number without those definitions cannot support a useful comparison.
For conversational responsiveness, choose the final caller speech sample as the beginning and first audible assistant response as the end. Record whether that first response contains useful information, an acknowledgment, or a filler phrase, because all three can start sound while producing different task experiences.
Suppose a caller finishes requesting an appointment and the agent immediately says, "Let me check." That audio establishes acknowledgment latency, while the later sentence containing actual available times establishes answer latency.
Both measurements matter. If you keep only first audio, a system can appear faster by adding acknowledgments while leaving the useful answer unchanged or making the overall exchange longer.
Define first audible response using a repeatable signal rule. For an automated corpus, that can be the first decoded output sample exceeding a documented energy threshold for a minimum duration, followed by a check that the detected sound belongs to the assistant response.
The threshold must account for the output noise floor. A click, comfort noise, or connection tone should not count as a substantive reply, and a soft consonant should not disappear just because a detector was tuned against loud synthetic speech.
A human annotation pass can establish ground truth for a smaller subset. Compare automated onset detection against that subset, inspect disagreements, and report the annotation uncertainty instead of presenting every millisecond as equally certain.
Endpointing requires another distinction. The end of recorded human speech and the time your system decides the turn has ended are separate events, and their difference measures one part of the response delay.
The voice activity and turn-detection guide explains why a thinking pause is not automatically an invitation to respond. A benchmark that removes all pauses before testing makes endpointing look simpler than the work your agent must perform.
Write a short contract before collecting calls. Include the input boundary, output boundary, units, clock owner, failed-turn definition, detector version, environment, and supported workload.
For example, your contract can state that a turn begins at the last annotated speech sample of an authorized prerecorded caller fixture. The response begins at the first verified assistant speech sample captured by the benchmark client, with detector disagreements sent to manual review.
That contract is specific enough to implement without pretending that the client capture equals sound reaching a human ear. If actual speaker output matters, add an acoustic loopback measurement and name that additional boundary.
Do not hide this distinction in a footnote. A browser receiving an audio frame, a browser scheduling it, and a microphone recording the speaker are three observations with different uncertainty and instrumentation costs.
A useful report can include all three. The mistake is changing the observation boundary between test runs while leaving the same metric label on the chart.
The same rule applies to calls that use tools. Define whether answer latency stops at a spoken status update or at a verified business answer, then connect that definition to the outcome scorecard.
Benchmark contract: name the start, name the finish, name the clock, and count the attempts that never reach the finish.
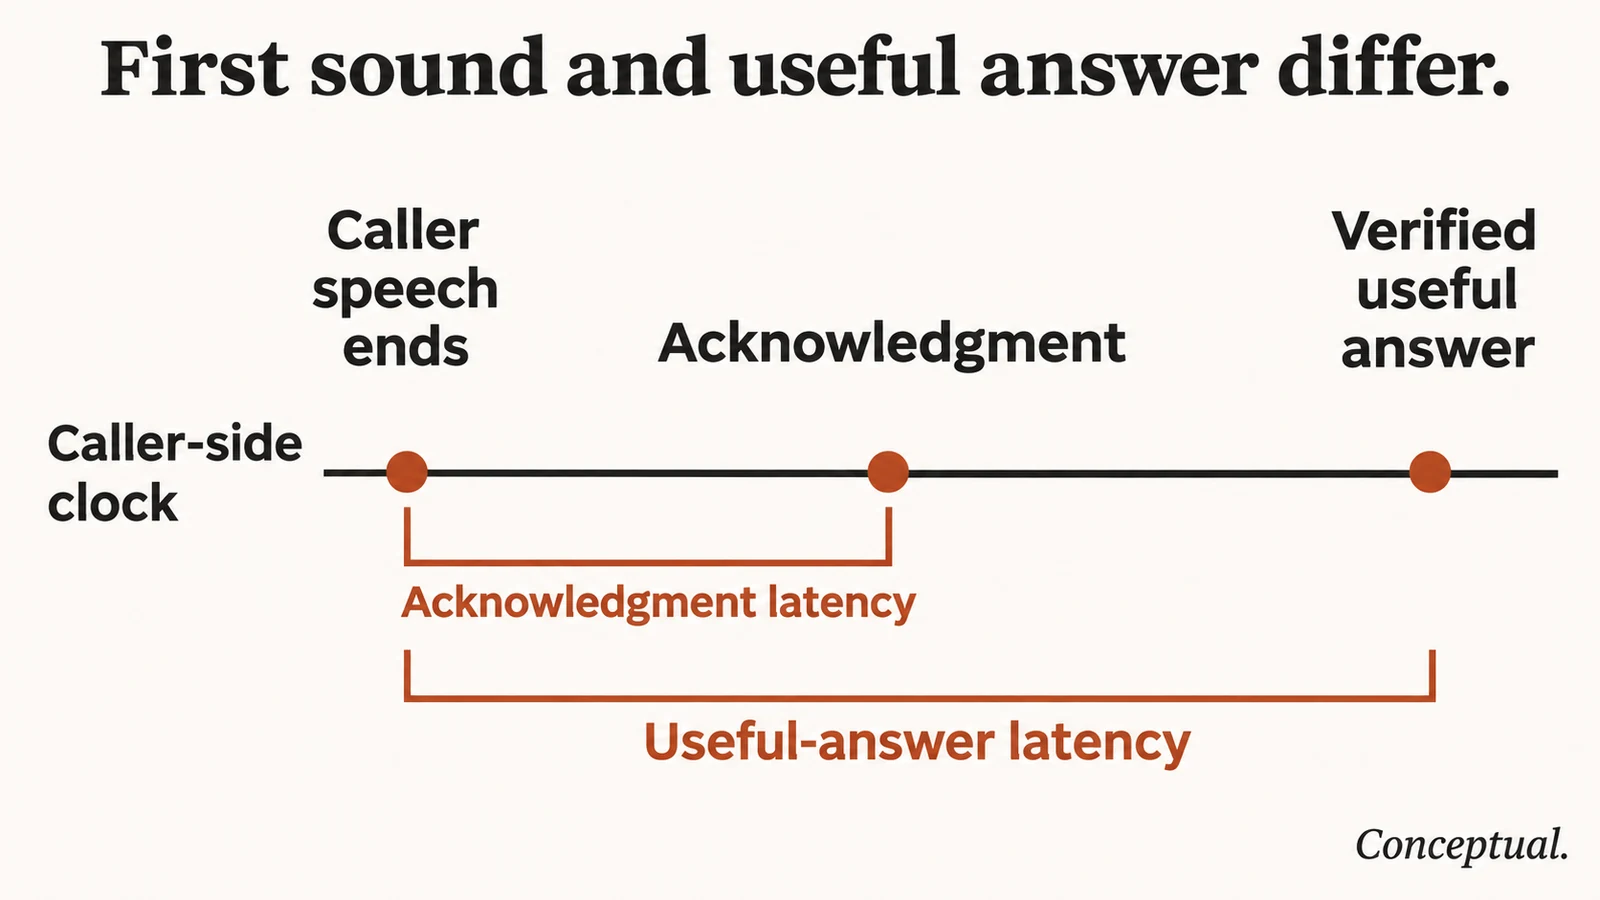
An acknowledgment can shorten first-sound timing without shortening the wait for useful information.
Which timings answer which questions?
The following table compares observation methods rather than ranking vendors. A check means the method directly observes the named boundary under its stated setup; a cross means additional instrumentation is required.
| Observation method | Server audio ready | Client audio received | Client scheduled playback | Physical speaker output | Main limitation |
|---|---|---|---|---|---|
| TTS provider request timer | ✓ | ✗ | ✗ | ✗ | Excludes downstream delivery |
| Server media egress event | ✓ | ✗ | ✗ | ✗ | Excludes client queues |
| Client frame arrival timestamp | ✗ | ✓ | ✗ | ✗ | Arrival can precede playback |
| Client playback instrumentation | ✗ | ✓ | ✓ | ✗ | Device path remains outside observation |
| Calibrated acoustic loopback | ✗ | ✗ | ✗ | ✓ | Adds room and capture uncertainty |
Treat the table as a measurement plan. Choose the lowest-cost method that answers your engineering question, then label its limits precisely enough that readers will not mistake a server timer for a caller experience.
Separate clock domains and response boundaries
A monotonic clock is appropriate for durations recorded by one process. It is not a universal time coordinate shared by a browser, a gateway, and a remote model service.
Python's time documentation specifies a monotonic clock for elapsed-time measurements and warns that its reference point is undefined. Subtract observations taken from unrelated clock origins and you can produce a plausible-looking duration with no valid physical interpretation.
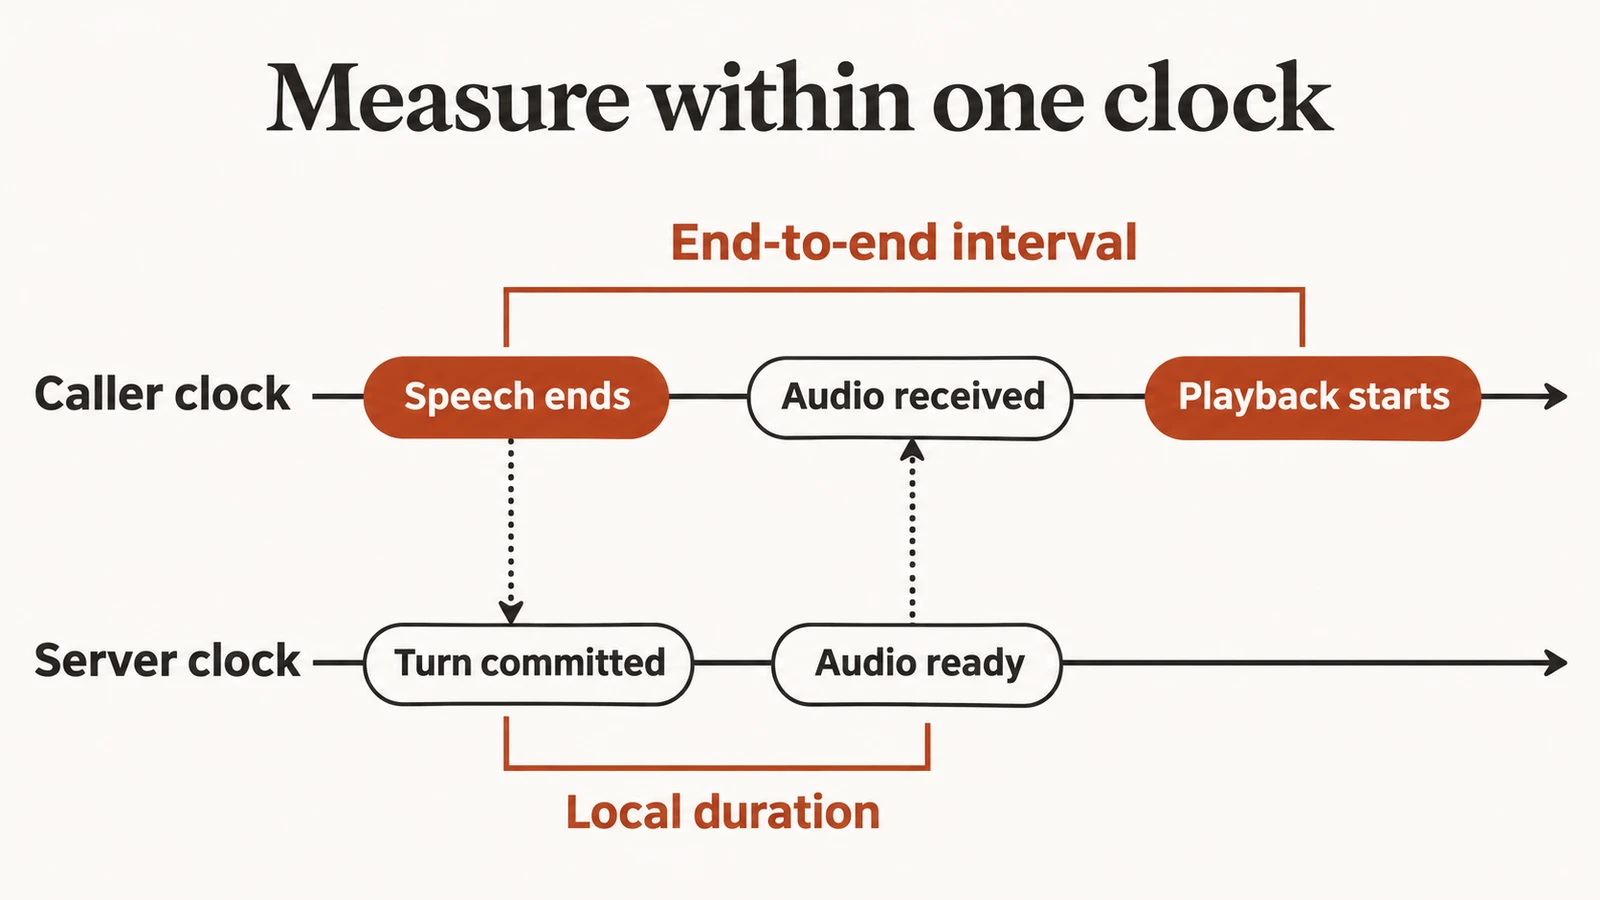
A caller-side benchmark avoids that problem for its headline measure. It observes both input speech completion and response playback within one client clock, then uses server measurements to explain the interval.
Distributed spans still help. A trace can preserve causal relationships, request identifiers, local durations, and parent-child structure without claiming that every timestamp shares perfect synchronization.
Use OpenTelemetry's trace model to connect related operations, then keep clock-source information in the evidence you export. A visually aligned waterfall should not be allowed to imply tighter synchronization than the collection setup supports.
If you require cross-host absolute timing, measure clock offset and uncertainty. Report the synchronization method, its operating conditions, and what happens when a host's clock correction exceeds the tolerance for your analysis.
For telephone routes, the SIP media troubleshooting guide helps establish whether a delay belongs to media delivery rather than model processing.
For ordinary debugging, locally measured spans plus a caller-side total are often enough. They let you establish that a tool request consumed much of the waiting time without requiring you to estimate one-way network delay from unsynchronized clocks.
Avoid assigning every unaccounted millisecond to the network. The residual can include queueing, missing events, serialization, endpointing, client buffering, detector error, and clock uncertainty.
The transport comparison helps identify which participant owns each buffer. WebRTC browser playback, custom WebSocket audio, and phone media do not expose identical timing events or failure surfaces.
A phone gateway acknowledgment is also not direct evidence of acoustic output on a remote handset. Name it as gateway or provider playback evidence and keep handset measurement as a separate experiment.
Draw the timing model before the chart
A turn usually contains overlapping work. Streaming recognition may run while the person speaks, and speech synthesis may begin while the language model is still generating the response.
Adding complete service durations can overstate total latency because some spans occur concurrently or before the speech-end boundary. Use a dependency graph to identify which operations delay the first usable response.
Diagram source (Mermaid)
flowchart LR
    A[Caller speech ends] -->|endpoint decision| B[Turn committed]
    B -->|response request| C[Model starts]
    C -->|required lookup| D[Tool result]
    D -->|answer text| E[First audio ready]
    E -->|transport and buffers| F[Caller playback starts]
    A -->|caller clock interval| F
This diagram expresses dependencies, not measured durations. Replace its simplified tool path when your system generates acknowledgments in parallel, performs multiple dependent calls, or uses native audio generation.
Include startup separately. Establishing a transport, loading a model, resolving credentials, and warming a process belong to a cold-start cohort rather than silently contaminating or disappearing from steady-state turn measurements.
Call setup latency is another product experience. A fast response after a slow connection does not make the whole interaction fast, so report connection-to-ready and speech-to-response as separate metrics.
For interruptions, add caller-speech-start to assistant-audio-stop. That measurement answers a different question from response onset and belongs beside the interruption state machine, where stale playback can outlive generation cancellation.
These definitions stop teams from optimizing one convenient timer while the caller's waiting experience remains unchanged. They also let an engineer choose the right trace when a reported slowdown concerns answering, stopping, connecting, or finishing a task.
Instrument a turn without inventing precision
Start with an event vocabulary. Each event should include an opaque run identifier, call identifier, turn identifier, event name, local timestamp, clock domain, configuration version, and measurement origin.
Use opaque identifiers instead of personal data. A telephone number is unnecessary for joining the events of a benchmark call and creates a disclosure risk when traces leave the restricted environment.
Event names should describe observations. audio_received records that bytes arrived; audio_played asserts something stronger and requires evidence from the component that owns playback.
A common instrumentation error is firing both from the same callback. That makes charts look complete while erasing the precise delay you intended to investigate.
Record event sequence numbers when a transport provides them. Duplicate or late events should remain visible to the validator rather than overwriting previous state and making an invalid trace appear complete.
For each turn, collect enough events to identify speech end, turn commitment, request start, first model output, tool boundaries when present, first audio ready, first client receipt, and first playback evidence. You do not need every optional event to calculate the caller-side total.
Missing an event should produce a missing field. Do not fill it with zero, copy a neighboring timestamp, or infer success from the lack of an error log.
The complete call trace guide extends the vocabulary to disconnects, outcome evidence, transcript revisions, and media delivery. Keep latency fields narrow enough that a collector can preserve them even when content logging is disabled.
A small local validator
The following Python example is vendor-neutral measurement code. It validates two events recorded on one clock, calculates a nearest-rank percentile, and refuses to summarize invalid observations as successful latency samples.
import math


def latency_ms(turn):
    if turn["start_clock"] != turn["end_clock"]:
        raise ValueError("clock domains differ")
    start = turn["speech_end_ms"]
    end = turn["playback_start_ms"]
    if any(isinstance(v, bool) for v in (start, end)):
        raise ValueError("boolean timestamps are invalid")
    if not all(isinstance(v, (int, float)) for v in (start, end)):
        raise ValueError("timestamps must be numeric")
    if not all(math.isfinite(v) for v in (start, end)):
        raise ValueError("timestamps must be finite")
    if end < start:
        raise ValueError("playback precedes speech end")
    return end - start


def nearest_rank(values, percentile):
    if not values or not 0 < percentile <= 100:
        raise ValueError("nonempty values and valid percentile required")
    ordered = sorted(values)
    return ordered[math.ceil(percentile / 100 * len(ordered)) - 1]


sample = {
    "start_clock": "client-monotonic",
    "end_clock": "client-monotonic",
    "speech_end_ms": 1000,
    "playback_start_ms": 1430,
}
assert latency_ms(sample) == 430
assert nearest_rank([100, 200, 300, 400], 95) == 400
try:
    latency_ms({**sample, "end_clock": "server-monotonic"})
except ValueError:
    pass
else:
    raise AssertionError("mixed clocks were accepted")
The values are an arithmetic fixture, not production measurements. Save the example to a local file and run it with Python; a successful exit confirms its three assertions, not the correctness of your audio capture or provider adapter.
A production collector also needs a schema, durable storage, duplicate detection, and explicit turn outcomes. Keep those responsibilities outside this small calculation so you can test timestamp validation without placing a live call.
Treat numeric types carefully when adapting the snippet. JSON booleans, strings containing numbers, missing keys, and unusually large values need a deliberate schema policy before ingestion.
Do not silently repair data at analysis time. A rejected record should retain an error reason and original attempt identifier so the collection team can distinguish a benchmark defect from an agent defect.
Preserve the event provenance
Record whether a timestamp came from a client callback, a provider event, an audio annotation, or a server span. Those origins answer different questions even when their values share the same unit.
A client callback can be delayed by a busy event loop. An audio annotation can have boundary uncertainty, and a provider event can describe an internal event whose delivery reaches your process later.
Capture event-loop stalls if your runtime supports them, especially during audio encoding and logging. CPU-bound work in the same execution thread can delay both playback and the timestamp recording that supposedly explains playback.
Keep raw audio only where the test's consent and retention rules permit it. For many regression runs, synthetic fixtures and event metadata are enough; see the local versus managed data-boundary guide before expanding collection.
Build a corpus that represents the workload
A benchmark corpus is a versioned description of the interactions your system must handle. Its purpose is to preserve meaningful variation while making repeated comparisons interpretable.
Start from task categories, not convenient audio clips. A direct factual question, a required account lookup, an appointment search, a correction, and a request for a human can take different paths through the same agent.
Keep ordinary turns and tool turns in separate cohorts. A change that shifts more calls into a slow tool path can worsen overall latency even if both component cohorts stay unchanged.
Represent speech timing explicitly. Include short requests, long requests, hesitation, a resumed sentence after a pause, and interruption during assistant speech.
The real-call regression harness explains how to turn these scenarios into release checks. For a latency benchmark, freeze the corpus version and distinguish deterministic playback inputs from live speakers whose timing varies across trials.
Record audio format, channel count, sample rate, encoding, duration, and provenance for each fixture. If the transport resamples or transcodes it, preserve both the source format and the format that entered the agent.
A clean studio recording alone does not represent a phone workflow. Add documented channel conditions without making unverified claims that your chosen noise or codec settings reproduce every real network.
For multilingual workloads, include language and code-switch labels. The multilingual benchmark treats names, dates, numbers, and task completion as separate evidence because a fast answer can still contain a costly recognition error.
Use speakers who have agreed to the test's actual purpose. A public recording is not automatically suitable for every collection, redistribution, or model-processing arrangement.
Hold configuration steady
Version the prompt, model selection, synthesis voice, endpointing settings, tool behavior, deployment region, client version, and transport path. Record everything that changes the work performed before first audio.
For managed services, some details may be unavailable. Mark those details unknown, preserve the public configuration you can control, and avoid attributing differences to an internal mechanism you cannot observe.
If you change multiple variables, call the run a system comparison. Do not claim that a prompt edit alone caused an improvement when the model, region, and concurrency also changed.
Separate warm and cold runs by an operational definition. A run is not warm just because it was launched second; a service may still recycle workers, expire connections, or route requests differently.
Record the elapsed idle period and connection reuse policy. They help explain whether an observed first-turn slowdown belongs to process startup, network establishment, or a model request.
A benchmark also needs a load description. State how many calls were active, how they arrived, whether the load generator had headroom, and whether the test used a steady rate or a burst.
Do not let the load generator become the slowest component. Measure its CPU use, media timing, and dropped events so that a client-side bottleneck does not masquerade as a provider regression.
Avoid contaminating comparisons
Run baseline and candidate close enough in time to reduce uncontrolled drift, and alternate or randomize their order when practical. A fixed baseline-first schedule can confound system differences with time-of-day or warm-up effects.
Use the same eligibility rules for both systems. If one system cannot complete a scenario, retain that failure in the comparison instead of removing the scenario only from its denominator.
Keep a written exclusion policy. Exclude an invalid fixture or a broken benchmark adapter for a stated reason, then apply that rule consistently and retain the excluded attempt counts.
A fair comparison can still have limits. State them directly: one region, one carrier route, one language mix, a selected concurrency range, and the observation boundary that was available for both systems.
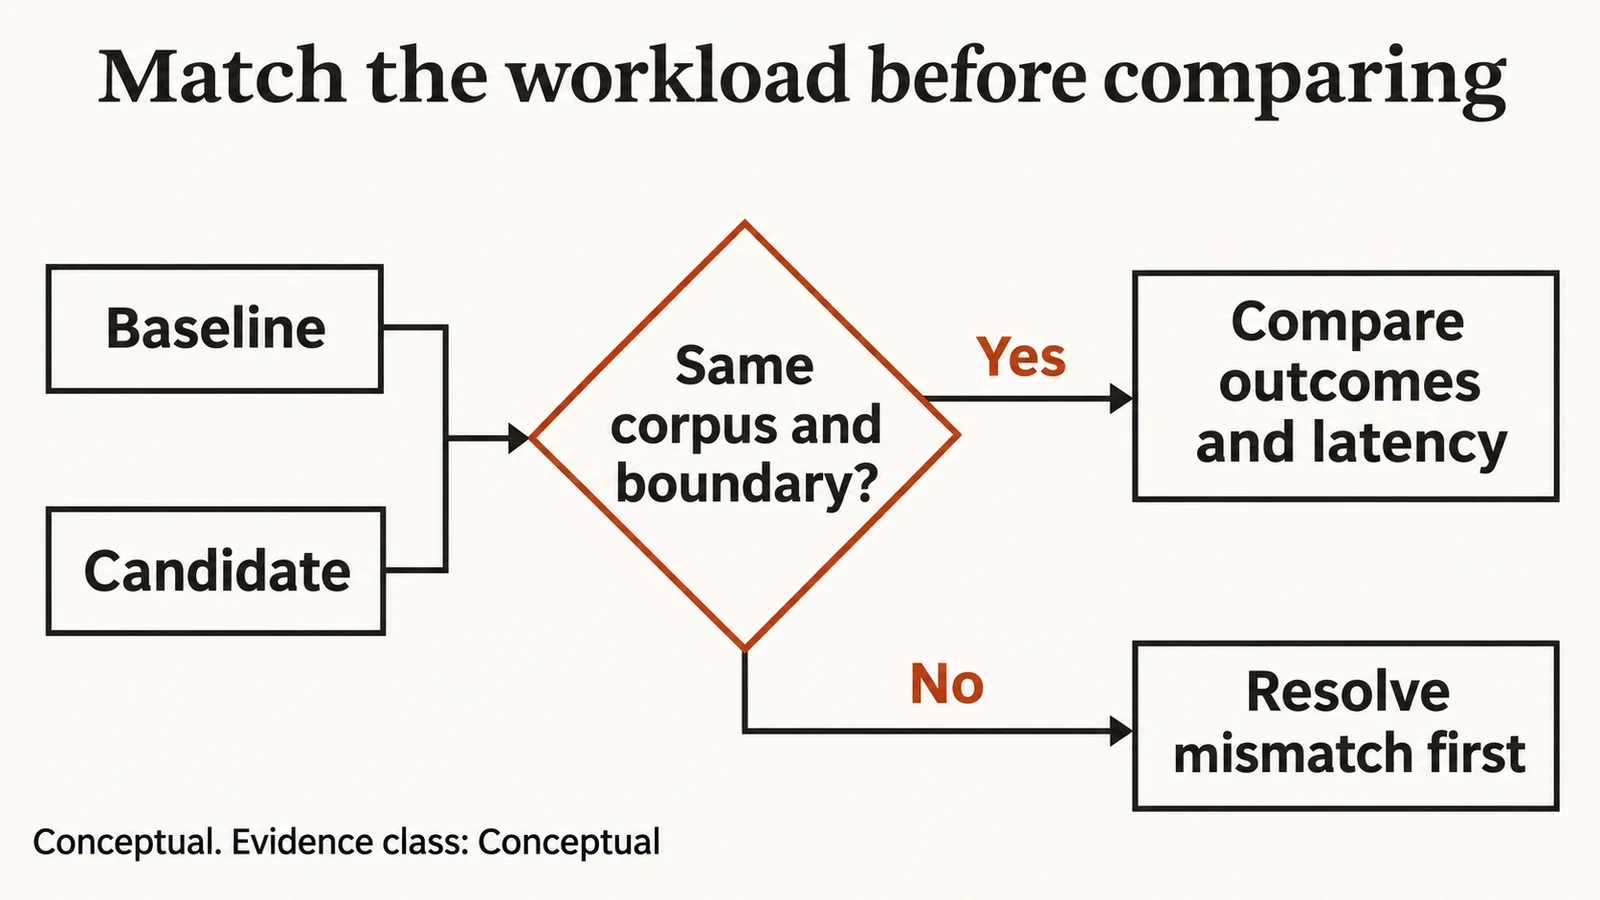
A comparison needs the same workload, observation boundary, eligibility rules, and repeat policy.
Calculate distributions and count failures
Latency is a distribution over attempts. A median describes the middle successful observation, while a tail percentile describes a different part of the experience and becomes unstable when only a few samples determine it.
Publish sample counts with every cohort. A p99 from a small run should not carry the same confidence as a repeated estimate supported by many observations across representative conditions.
Choose a percentile convention and retain it across releases. Nearest-rank and interpolated percentiles can return different results for the same short list, so the calculation is part of the benchmark definition.
The Python snippet uses nearest rank because its behavior is easy to inspect. You can choose another established method if your reporting tool supports it, provided the report names the method.
Do not average percentiles from separate runs to create a combined percentile. Combine the individual compatible observations and recompute, or report each run independently when their conditions differ.
The same applies to cohorts. An overall p95 does not tell you whether an increase came from slower ordinary answers, more tool calls, a new language mix, or a different transport share.
Keep unsuccessful attempts visible
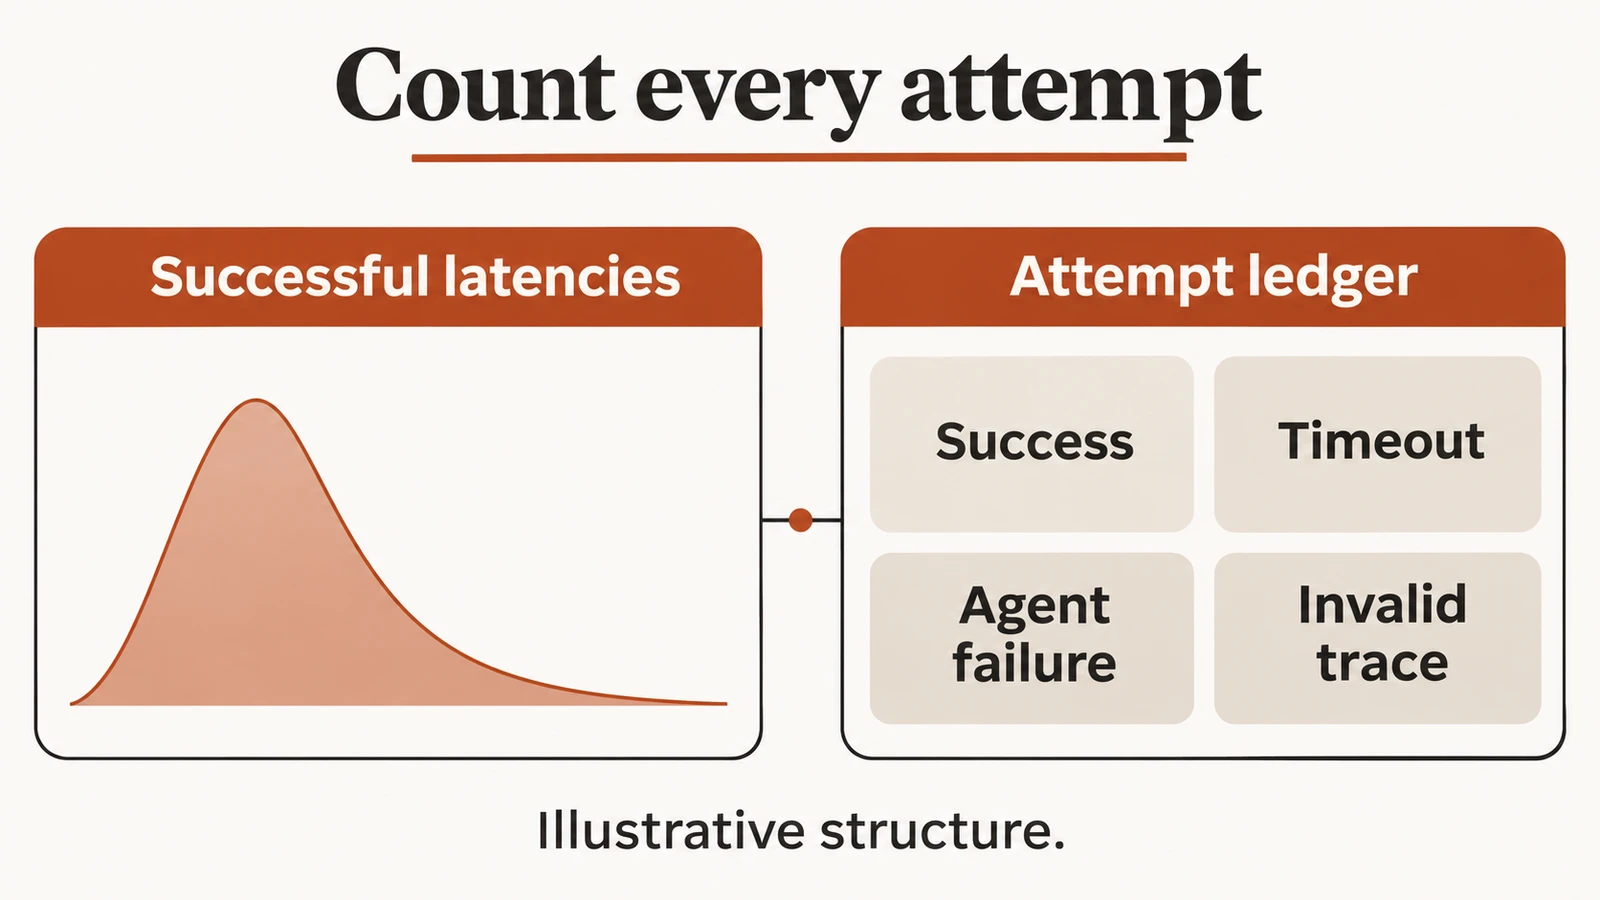
An attempt with no response has no finite successful response latency. Store a timeout outcome and the observation deadline rather than replacing it with a fabricated latency value.
An invalid trace is different again. If playback occurred but instrumentation failed, your system may have answered while the benchmark cannot establish the duration.
Report successful observations, agent failures, timeouts, and invalid measurements separately. This prevents a system that responds quickly to easy requests and never answers difficult ones from appearing superior on a successful-only chart.
A deadline can support a second metric: the fraction of eligible attempts with a useful answer before the chosen deadline. That deadline is a product criterion, not a universal standard for conversation quality.
Choose it before looking at the candidate results. Changing the deadline after a run to make one system pass is an evaluation-policy change and should be disclosed as such.
For a release decision, pair timeliness with correctness. An immediate unsupported promise should fail a task assertion even if it produces the best onset latency in the dataset.
This is why enforced workflows and speculative tool safety belong beside performance work. Faster execution is useful only when the resulting action still respects the caller's confirmed intent.
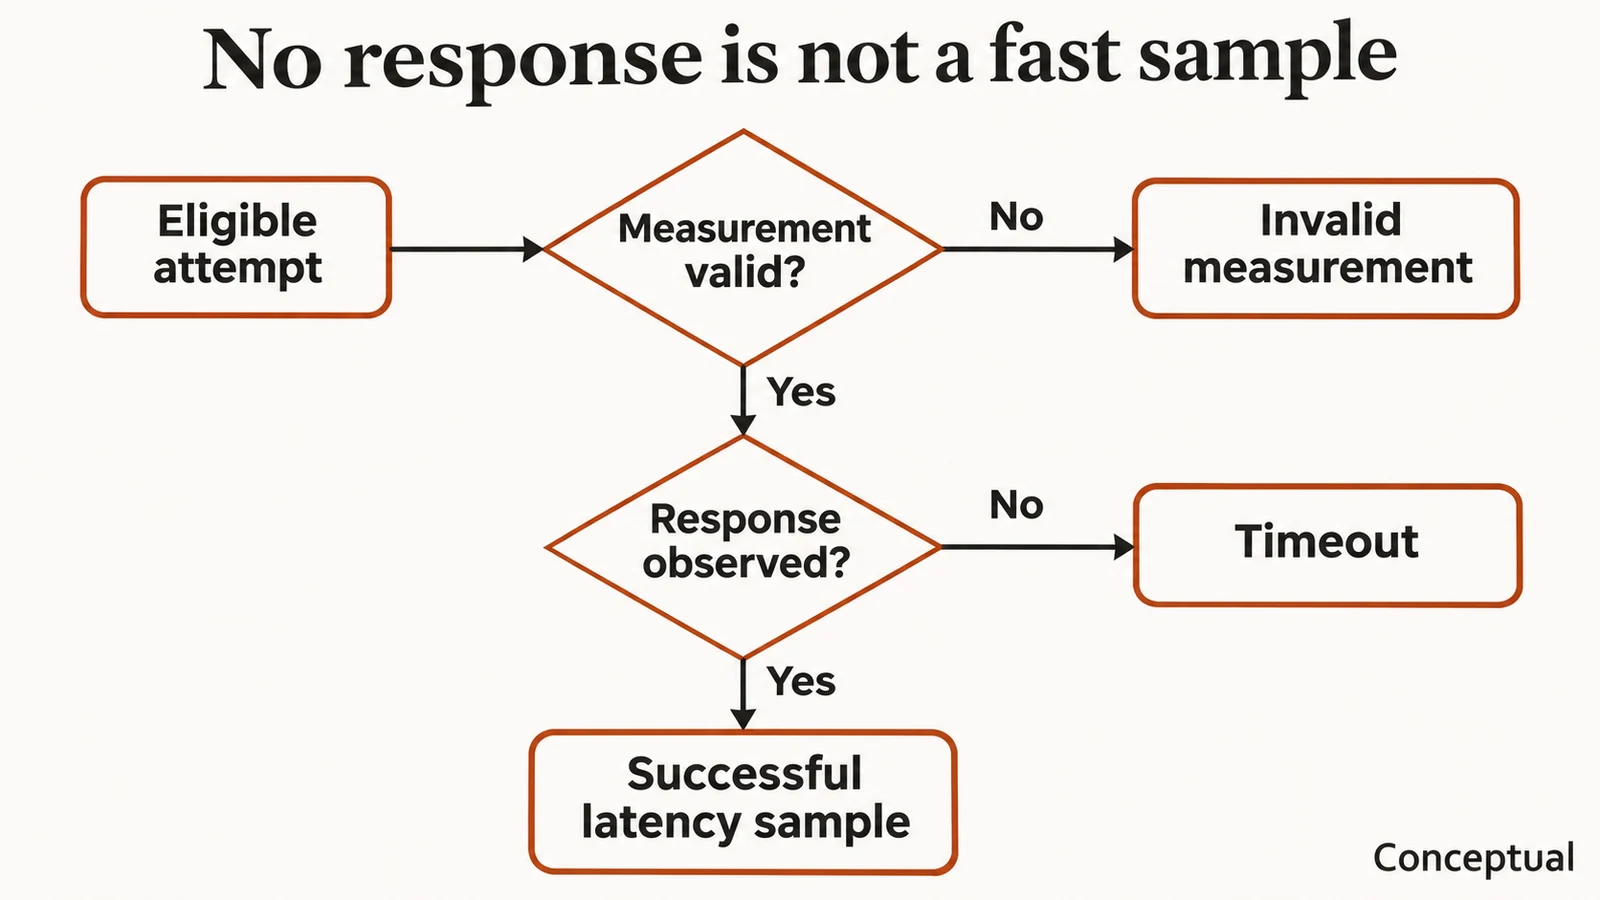
Keep timeouts and invalid measurements visible outside the successful-latency distribution.
Interpret uncertainty honestly
Repeated calls from the same session are related observations. They can share a transport, worker, speaker, or temporary service condition, so they do not always behave like independent samples.
When estimating uncertainty, preserve the clustering that matters to your decision. For example, resampling whole calls rather than isolated turns can better reflect a workload where one bad connection affects multiple answers.
Document any bootstrap or confidence-interval method you use. If the run is too small for a defensible tail claim, publish the observations and call it a pilot instead of decorating the chart with unsupported precision.
Inspect the slowest cases. A tail change caused by an intentional security confirmation has a different product interpretation from a tail change caused by a queue that stopped draining.
Use recordings and redacted traces to classify those cases. Aggregate numbers tell you where to investigate; they do not explain what happened in the conversation.
Find the critical path before optimizing
The fastest component is not necessarily the component worth changing. An optimization matters to first response only when it shortens an operation that lies on the response's critical path.
Consider an illustrative tool turn. If the answer needs an inventory lookup, faster text generation after the lookup can help, but generating an acknowledgment earlier does not reduce the lookup's completion time.
Start with the caller-side total and work inward. Identify the interval that dominates the slow cohort, verify that its instrumentation describes the intended event, and reproduce the pattern in individual traces.
Endpointing is a common candidate because it directly delays turn commitment. Tightening the threshold without checking premature cutoffs can exchange visible silence for interruptions and repeated questions.
Compare latency against false-cutoff and false-interruption rates. Keep the cases where the caller resumes after a pause, because those cases reveal whether a lower threshold changed the conversation boundary.
Tool latency has a different shape. An external service timeout, queue, or authorization check may consume the answer budget even when the language model is ready to speak.
Bound the tool's waiting policy and define the fallback. If a tool cannot answer in time, the agent should say what it knows, ask to continue, or offer a supported handoff according to the workflow rather than inventing the missing result.
The warm handoff design treats transfer as a stateful operation with its own failure paths. Measure transfer progress separately from ordinary answer onset.
Optimize concurrency with ownership
Overlap independent work when the dependency graph allows it. You can start a permitted read while generating a response plan, but a write that changes customer state needs the confirmed intent and authorization required by the business operation.
Speculation increases the need for cancellation and stale-result rejection. An early read that completes after a correction must not supply outdated arguments to a later action.
Measure wasted work. Lower answer latency can arrive with higher provider usage, more open connections, and more canceled requests, which changes cost per successful call.
Set limits on concurrent speculative work. A benchmark should expose whether faster median turns create queueing for other calls under load.
Transport optimizations need the same discipline. Reducing a playback buffer can improve responsiveness under good conditions while increasing underruns on a less stable route.
Listen to the audio. A lower onset number does not compensate for missing initial phonemes, broken speech, or frequent restarts that make callers ask for repetition.
Finish the lifecycle
Call completion and resource cleanup belong in the benchmark's operational checks. A service that leaves media tasks alive after hangup can accumulate load across a long test and distort later measurements.
The shutdown semantics guide separates call-bound work from approved post-call work. Apply that boundary in the load generator as well as the agent.
Track every test connection and terminate the resources the harness creates. Preserve failure artifacts before cleanup, then verify that calls, media streams, and temporary workers have reached their expected terminal states.
A clean teardown is not an optional housekeeping step. It is how you know that the next trial starts under the conditions your benchmark report claims.
Run comparisons and release decisions
A release report should support a concrete decision. Begin with the workload, configuration, corpus version, observation boundary, and number of eligible attempts, then show latency distributions and failure rates for the same cohorts.
Include correctness evidence before calling a candidate faster. If the system answers with a placeholder, omits a required lookup, or stops understanding a language cohort, that behavior changes what the latency number represents.
For 60db Agent, apply the same black-box contract you apply to another supported system. Verify the current public test surface and your workspace's permissions, and do not assume public inbound availability.
A browser test can establish browser-path behavior. An authorized outbound test can establish behavior on that route, but neither justifies a claim about every transport, carrier, region, or deployment.
Do not infer architecture from a result. A short response interval does not prove a specific caching strategy, a private model, or a proprietary orchestration method.
Keep product evaluation separate from product implementation claims. Your measurement can say what the caller observed under the tested conditions without exposing or inventing the internal mechanism.
Define acceptance before the run
Write acceptance criteria for useful-answer latency, cutoff rate, stale-audio behavior, task completion, and measurement validity. Pick criteria that reflect the intended task and the cost of a mistake.
Some checks are hard invariants. A duplicate payment or an unauthorized disclosure should not become acceptable because the median latency improved.
Other checks are trade-offs. A small onset regression may be reasonable when the candidate resolves a major correctness defect, but the release owner should see both facts in the report.
Store the baseline and candidate configuration alongside the artifacts. A screenshot alone cannot tell a future engineer which prompt, model settings, audio fixtures, and tool behavior produced the chart.
Include a reproduction command that references your actual harness. If the adapter requires credentials or a permitted phone route, describe those requirements without publishing secrets or pretending the command can run in every account.
Make the report useful after release
Keep a compact summary for reviewers and a machine-readable attempt ledger for analysis. The ledger should preserve enough structure to recompute the headline metrics without granting access to raw personal audio.
Retain a sample of slow and failed traces according to your privacy policy. They become regression cases when the team fixes the cause, turning one incident into a repeatable check.
Monitor the same boundaries in production where permitted. A laboratory corpus is controlled evidence; production observations reveal new workload mixtures, network conditions, and caller behaviors that the corpus may not yet cover.
Add a new fixture only when it represents a meaningful behavior or failure class. A corpus that grows without ownership becomes expensive to run and difficult to interpret.
Finally, revise the benchmark contract when the product changes. A new transport, a new handoff workflow, or a different definition of successful completion can require a new cohort rather than a quiet adjustment to the old chart.
Frequently asked questions
What is voice agent latency?
Voice agent latency is elapsed time between defined events in a voice interaction. For conversational response measurement, use the end of caller speech and the beginning of verified assistant playback, with both observations tied to a named clock.
Is TTS time to first byte an end-to-end metric?
No. TTS time to first byte describes one service boundary and excludes earlier turn processing and later media delivery. It is useful for component debugging when the report keeps its scope explicit.
Should I measure the first word or the complete answer?
Measure both when they answer different product questions. First-word timing captures responsiveness, while complete-answer timing shows when the caller receives the information needed to act or confirm the next step.
Does an acknowledgment count as a response?
It can count as first audible response if your contract says so. Also record useful-answer latency, because an acknowledgment can start quickly while a required lookup keeps the caller waiting for the answer.
Can I subtract a browser timestamp from a server timestamp?
Only when you have established a shared time basis and its uncertainty. For the headline metric, observing start and finish on one client clock avoids unsupported cross-host subtraction.
Why use a monotonic clock?
A monotonic clock supports elapsed-time measurement without depending on wall-clock calendar adjustments. Its origin is local to the clock definition, so you still need care when joining measurements from different processes or hosts.
How many calls establish a reliable p99?
There is no universal call count that fits every workload and confidence requirement. Publish the sample size, repeat the experiment, inspect uncertainty, and avoid strong tail claims when only a few observations determine the estimate.
Should failed calls appear in latency charts?
Keep failed attempts in the report with their own outcome counts. Successful-only latency can hide a system that quickly answers easy requests while timing out on the cases that need more work.
Can I average p95 values from several runs?
An average of p95 values is not the pooled p95. Recompute the percentile from compatible individual observations, or report the separate runs when conditions make pooling inappropriate.
How do I benchmark a tool-heavy agent?
Create separate cohorts for tool and non-tool turns, then record required tool dependencies. Verify the business result so that skipping a lookup does not look like a performance improvement.
How do I detect the final caller speech sample?
Use an annotated corpus or a documented speech-boundary detector. Validate the detector against human-reviewed examples, especially for quiet endings, hesitation, background sound, and words that resume after a pause.
Does a playback acknowledgment prove the caller heard audio?
It proves only the boundary described by the system producing that acknowledgment. Physical handset or speaker output requires additional observation, and human comprehension requires a separate task-level evaluation.
How do codecs affect the benchmark?
Codecs and transcoding can alter audio quality, frame timing, and processing work. Record the source and delivered formats so that a transport change does not silently change the workload being compared.
Should I remove the first turn from a run?
Only under a documented rule that applies equally to all compared systems. First-turn and cold-start behavior are often valuable product measurements, so a separate cohort is usually more informative than deletion.
How should interruptions be measured?
Measure from confirmed caller speech onset to the end of assistant playback, then check for stale audio that resumes later. Keep this interruption-stop measure distinct from the next response's onset latency.
Can a smaller playback buffer improve latency?
It can shorten queued playback under some conditions. Measure underruns and audio continuity as well, because a shorter buffer can make speech more fragile when delivery timing varies.
What should a provider comparison disclose?
Disclose the observation boundary, corpus, region, transport, configuration, concurrency, sample counts, failures, and exclusions. State unknown internal details instead of inventing a reason for the observed difference.
Can I benchmark 60db Agent through a browser?
Use a currently documented browser test surface when your workspace supports it. Treat the result as evidence for that tested path, and verify outbound-call permissions separately before placing authorized phone tests.
Do latency improvements always reduce cost?
No. More parallel requests and speculative work can reduce waiting time while increasing usage or resource pressure. Compare cost per completed task alongside latency before adopting the change.
What is the first benchmark I should build?
Start with a small versioned corpus, a caller-side duration, explicit outcomes, and a trace for every failed attempt. Add component detail only when it helps explain a real uncertainty in that first measurement.
Build a benchmark you can defend
A defensible voice agent latency benchmark makes its observation boundary visible. It preserves unsuccessful attempts, distinguishes acknowledgment from useful answer, and gives every chart enough context to be reproduced.
Use one caller-side clock for the headline duration where possible. Add local server spans to explain the waiting time, then inspect the traces behind slow cohorts before changing a model, a silence threshold, or a media buffer.
The practical deliverable is a small evidence package: a measurement contract, versioned corpus, configuration record, attempt ledger, distribution summary, and selected redacted failure traces. That package remains useful when the provider changes because its definitions belong to your product's needs.
Start with one workflow you can verify end to end. If you are evaluating 60db Agent, confirm the public test surface available to your workspace, run the same permitted corpus, and decide from observed response timing and task completion rather than a component-latency slogan.