
- Engineering
Debug voice agents with a complete call trace
Voice agent observability connects audio, turns, tools, playback, and outcomes without turning traces into transcript archives.
- Author
 Udit Goenka
- Published
- Reading time
- 23 min
TL;DR: A useful voice-agent trace connects call lifecycle, speech boundaries, response generation, tools, and audible playback through explicit identities and clock domains. Collect enough metadata to explain a failed turn, preserve uncertainty where a provider hides a boundary, and keep sensitive content outside the default telemetry path.
The caller heard a long pause, your model dashboard shows a fast request, and the call finished with a successful transport status. All those observations can be true while the caller's task failed.
A voice conversation crosses several boundaries that ordinary request tracing does not automatically capture. Audio arrives continuously, responses overlap new speech, tools finish after cancellation, and a call's business outcome can become known after the media session closes.
Start with a concrete question: which event prevented this caller from hearing the correct next response? Answering it requires the speech-to-playback measurement boundary, plus identities that survive asynchronous work and a clear account of what the instrumentation cannot observe.
Reviewed November 9, 2026. This is an instrumentation design and debugging method based on public standards and documented product surfaces; example events are synthetic, and no production trace or measured improvement is claimed.
Table of contents
- Define what a complete trace means
- Choose identities and event boundaries
- Measure time without inventing precision
- Instrument the conversation lifecycle
- Debug failures through causal evidence
- Control telemetry cost and privacy
- Connect traces to outcomes
- Validate the instrumentation
- Frequently asked questions
- Build one trace you can trust
Define what a complete trace means
A complete trace explains the supported boundaries of a call, including the boundaries you cannot observe. It does not require collecting every packet or storing every word the caller says.
Define completeness against a question. To diagnose slow answers, you need endpoint acceptance, generation milestones, audio availability, and playback evidence; to diagnose duplicate bookings, you need tool identity, authorization, idempotency, and business-system confirmation.
One trace can support both questions, but their minimum evidence differs. Building a universal event firehose before deciding what you need usually raises cost and exposure without guaranteeing that the missing causal edge becomes visible.
OpenTelemetry's traces documentation describes traces as related spans of work. Voice systems benefit from that model, provided a long call is not flattened into one span whose only information is total duration.
The useful units are operations with ownership. A call owns a session lifecycle; a turn owns a response attempt; a tool attempt owns one request; a playback segment owns audio the device may actually render.
Some relationships are causal without being parent-child relationships. A late webhook or a queued post-call job can refer back to the original call through a link rather than extending a live call span indefinitely.
Separate telemetry signals by their job
Metrics summarize distributions and rates. Traces explain individual paths, while logs preserve discrete diagnostic records that may not fit neatly into an operation interval.
A p95 response-time metric can reveal a regression. It cannot identify whether one slow response came from endpointing, a tool timeout, or a full client playback queue unless the underlying events preserve those distinctions.
A transcript helps inspect language behavior, but it is not a timing trace. It often omits exact audio boundaries, canceled responses, transport loss, and the difference between generated speech and speech the caller actually heard.
Recordings add another view with their own consent and retention requirements. Use them selectively for authorized analysis, and do not make raw recordings a prerequisite for every metadata-level diagnosis.
The data-boundary comparison is relevant because observability itself creates data flows. Sending call metadata, prompts, tool arguments, and recordings to one analytics vendor is a processing decision, not a neutral byproduct of debugging.
Use a capability matrix
The following table describes evidence types rather than comparing vendors. A checkmark means the evidence can answer that question when correctly collected; a cross means it cannot establish the answer alone.
| Evidence | Call connected | Why a turn waited | Audio was heard | Business action committed |
|---|---|---|---|---|
| Signaling status | ✓ | ✗ | ✗ | ✗ |
| Model request timing | ✗ | Partly | ✗ | ✗ |
| Turn trace | Partly | ✓ | Only with playback evidence | Only with tool confirmation |
| Recording | Partly | Partly | At its capture boundary | ✗ |
| Client playback observation | ✗ | Partly | ✓, at instrumented boundary | ✗ |
| Authoritative business receipt | ✗ | ✗ | ✗ | ✓ |
The matrix prevents category errors. A completed call is not a completed appointment, a recording is not proof of device playback, and a tool's HTTP success is not necessarily a committed transaction.
For SIP troubleshooting, signaling and media need separate evidence. For outcome measurement, the final authority often lives outside the voice provider entirely.
Choose identities and event boundaries
Give every durable entity an identity whose lifetime matches that entity. At minimum, distinguish the call, input turn, response attempt, tool operation, tool attempt, and playback generation.
A response attempt can be canceled and replaced within one user turn. A tool operation can have several transport attempts, and a call transfer can create another media leg without creating a new business task.
If all these events share one ambiguous request identifier, debugging becomes guesswork. A late response looks like a duplicate, a legitimate retry looks like a second business action, and an unrelated call leg looks like a continuation of the first socket.
Use opaque, nonsemantic identifiers. Do not encode phone numbers, email addresses, names, or account references into an identifier just because it is convenient to search.
The W3C Trace Context specification standardizes propagation through HTTP headers. Use existing tracing libraries for those headers, and keep application call or turn identifiers as separate attributes rather than manufacturing a custom trace-header format.
Keep operation identity separate from attempt identity
Suppose a booking operation times out after the business service committed the reservation. A retry should carry the same business idempotency identity while receiving a new network-attempt identity.
That distinction lets a trace show one intended write and multiple delivery attempts. Without it, an operator cannot tell whether a duplicate request was safe replay or a second booking that should never have existed.
Record the requested tool and the resolved tool identity when routing or aliases are involved. Authorization should apply to the resolved action, and the trace should make that boundary inspectable without exposing the action's private arguments.
The speculative tool-calling guide explains why early work needs additional labels. A trace must distinguish speculative read, confirmed invocation, discarded result, and committed write so latency optimizations do not conceal side effects.
Establish a small event vocabulary
Use stable names that describe observations: input speech started, endpoint accepted, response requested, first audio received, playback started, interruption confirmed, tool result received, and call closed.
Avoid event names that smuggle in conclusions. An event called user-finished may really mean the detector observed silence, while an event called booking-success may really mean a tool returned a syntactically valid JSON body.
Attach a reason to policy decisions. Endpoint accepted because a silence timer expired is different from endpoint accepted after explicit user release, and both differ from an idle reminder generated without a new utterance.
The VAD and turn-detection guide gives those decisions a vocabulary. Reuse that vocabulary in your instrumentation so audio and conversation teams do not interpret the same label differently.
Preserve causal ordering
A response-request event should reference its input turn. A playback-start event should reference the response attempt and playback generation, while a cancellation event should identify which generation became invalid.
Use event sequence numbers within an owning process or stream when they help detect gaps. They establish local ordering, but they do not replace timestamps or prove a global order across machines.
Asynchronous work needs explicit edges. A tool result arriving after cancellation should still appear in the trace with a discarded or retained outcome, rather than disappearing because the original response span has ended.
OpenTelemetry's tracing API includes span links for relationships beyond a single parent chain. The design choice is to preserve the actual relationship rather than force every operation into a misleading tree.
Measure time without inventing precision
A timestamp is meaningful only with its clock domain and event boundary. Millisecond formatting does not make two unsynchronized machines agree to the millisecond.
Use a monotonic clock for durations inside one process. Use wall-clock timestamps for approximate cross-system correlation, with synchronization and uncertainty understood, rather than subtracting arbitrary wall-clock values as if they were one stopwatch.
Browser audio, server processing, carrier events, and provider telemetry can each have distinct clocks. Store the origin of each timestamp and document whether it describes source occurrence, local observation, or collector receipt.
Collector arrival order is especially misleading under backpressure. A later event can arrive first, and a batch can reach the backend after the operation it describes has already finished.
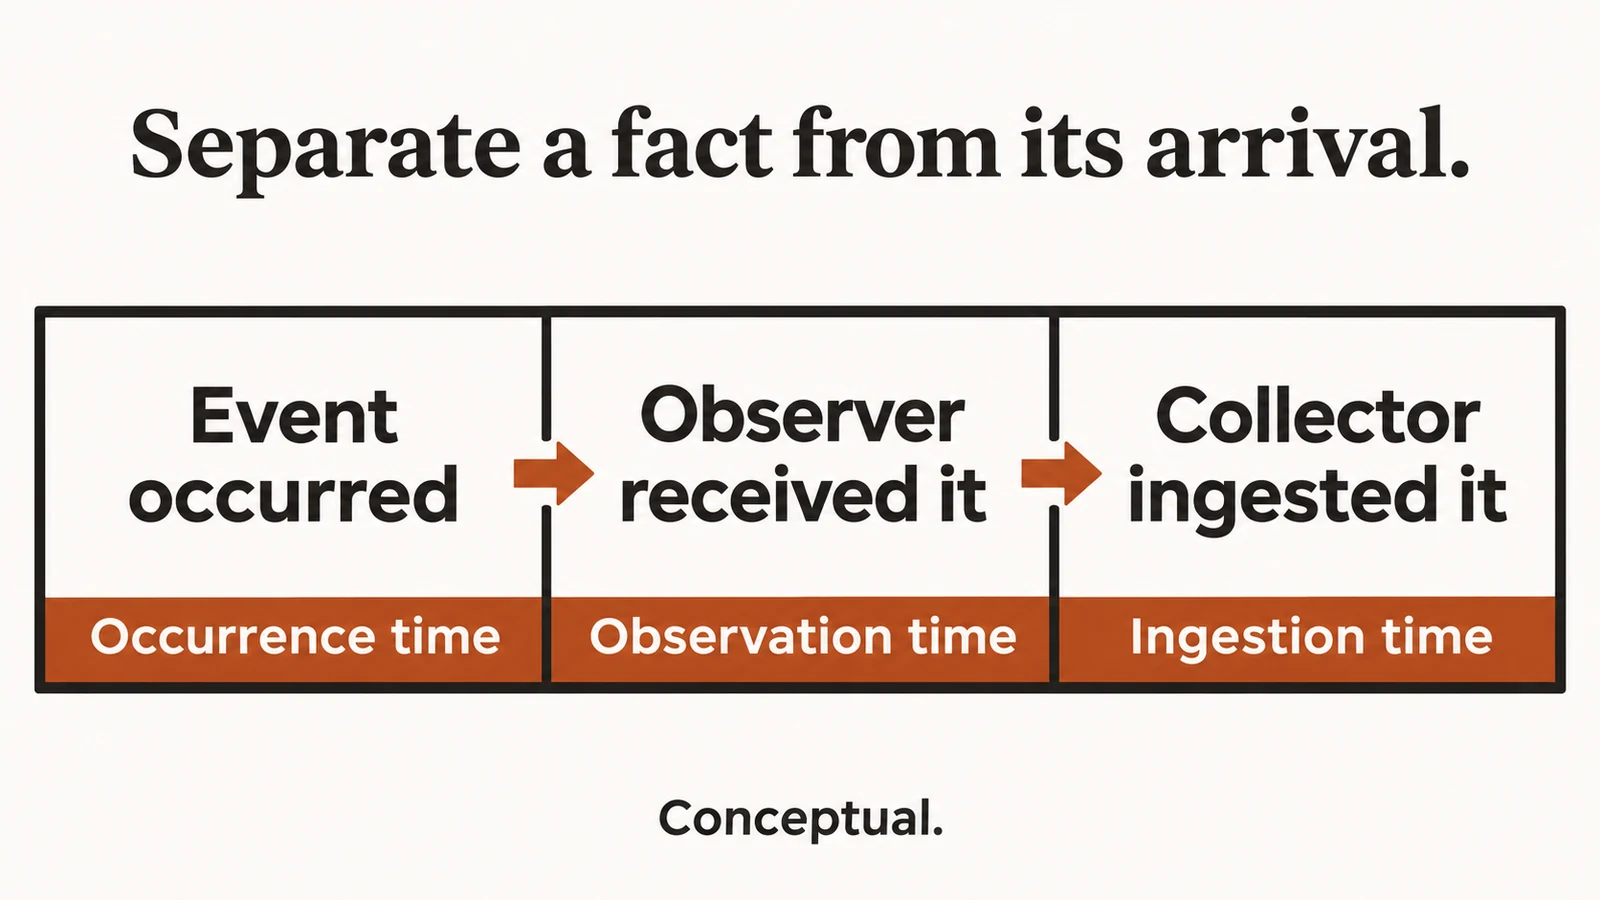
Occurrence, observation, and ingestion timestamps describe different boundaries and must keep their clock meaning.
Define the latency boundaries
For each latency metric, write its start event and end event in plain language. Endpointing delay, model first-token delay, synthesis first-byte delay, and audible response delay answer different questions.
A server can receive audio bytes before the client is ready to play them. Audio can also be buffered, canceled, or dropped after generation, so a first-byte event is insufficient proof that a caller heard anything.
Do not add overlapping stage durations to obtain end-to-end latency. Streaming recognition, model generation, tool work, and synthesis can overlap; the critical path follows dependencies, not the sum of every visible span.
The latency benchmark protocol explains how to publish distributions with a defensible boundary. The trace should retain the raw milestones needed to recompute those metrics when a definition changes.
Make uncertainty visible
If you cannot observe device playback, label the endpoint first audio available or first audio sent. Do not rename it audible response because that is the metric a dashboard stakeholder wanted.
If a provider reports an internal timestamp without its clock relationship to your host, keep it as provider-relative evidence. A trace can still show the reported duration without pretending it can place every event precisely on one unified timeline.
Use uncertainty bands or separate lanes in a visualization. A gap between two lanes can be unknown rather than slow, and that difference determines whether you investigate transport, ask the provider for more evidence, or instrument the client.
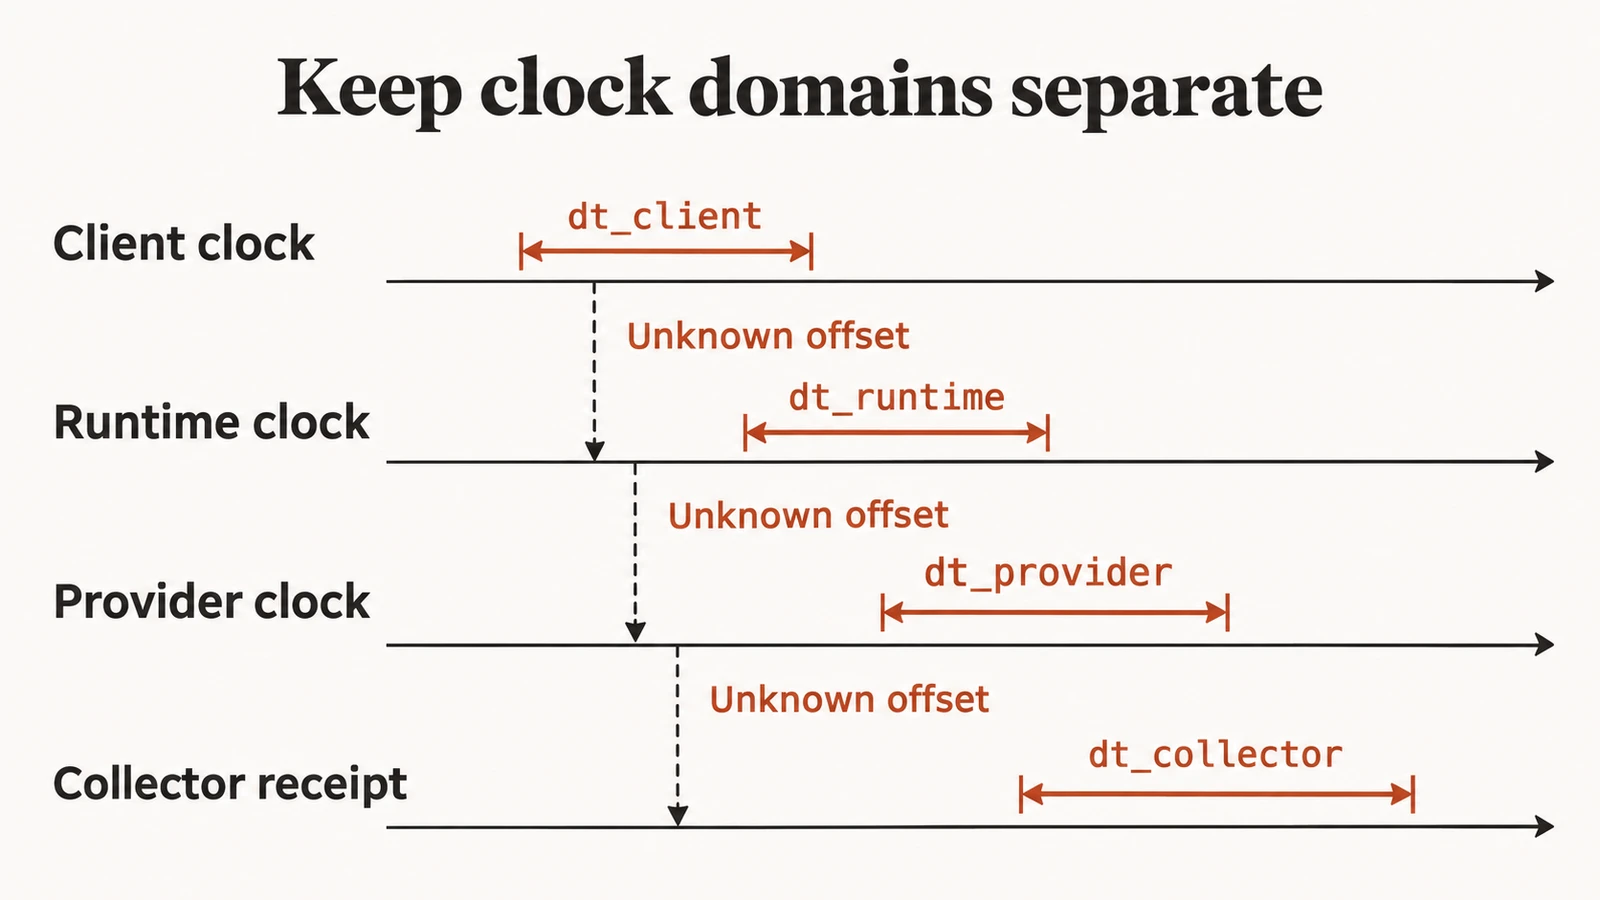
A negative interval is a diagnostic signal. It can reveal clock mismatch, a misidentified event, or a legitimate speculative operation that started before the input boundary; clipping it to zero destroys the clue.
Interpret browser media statistics carefully
The W3C WebRTC statistics specification defines counters and timing information for an RTCPeerConnection. Those fields apply when your actual transport uses WebRTC and the browser exposes the relevant statistics.
Do not assume a managed browser test uses WebRTC because it runs in a browser. Verify the public transport contract and instrument only the interfaces your integration actually owns.
For a WebSocket audio route, collect queue depth, received frames, decoded samples, and playback state through the application's own media path. A WebRTC packet-loss field does not exist merely because you want an equivalent chart.
The transport comparison explains these boundaries. Keep transport-specific metrics attached to their route instead of filling absent fields with zeros that falsely imply perfect quality.
Instrument the conversation lifecycle
Start with the call lifecycle, then add turn-level operations. Record accepted start, media ready, conversation active, close requested, media closed, and post-call processing outcomes where those events are observable.
Do not collapse close requested and media closed. A call can remain billable or retain resources after the application asks it to end, and a late webhook can arrive after the user-facing session has already disappeared.
Each input turn should record speech observations, endpoint decisions, and the response attempts caused by that turn. Preserve a link to an authorized fixture or recording only when the data policy permits it.
Each response attempt needs a terminal reason. Completed, interrupted, superseded, timed out, provider failed, and call closed are different outcomes even if they all stop the same stream.
Diagram source (Mermaid)
sequenceDiagram
    participant C as Client media
    participant R as Conversation runtime
    participant P as Model provider
    participant T as Tool backend
    participant O as Telemetry collector
    C->>R: Input speech with call and turn identity
    R->>O: Endpoint accepted with reason
    R->>P: Response attempt
    P->>R: Tool request
    R->>T: Authorized operation with idempotency identity
    T-->>R: Authoritative result or explicit uncertainty
    R->>O: Tool outcome linked to response
    R-->>C: Audio generation
    C->>O: Playback observation with clock domain
    R->>O: Response terminal reason
The sequence is a vendor-neutral observability contract. It does not assert that every provider exposes every internal operation or that 60db Agent implements these exact spans.
Trace cancellation as a lifecycle
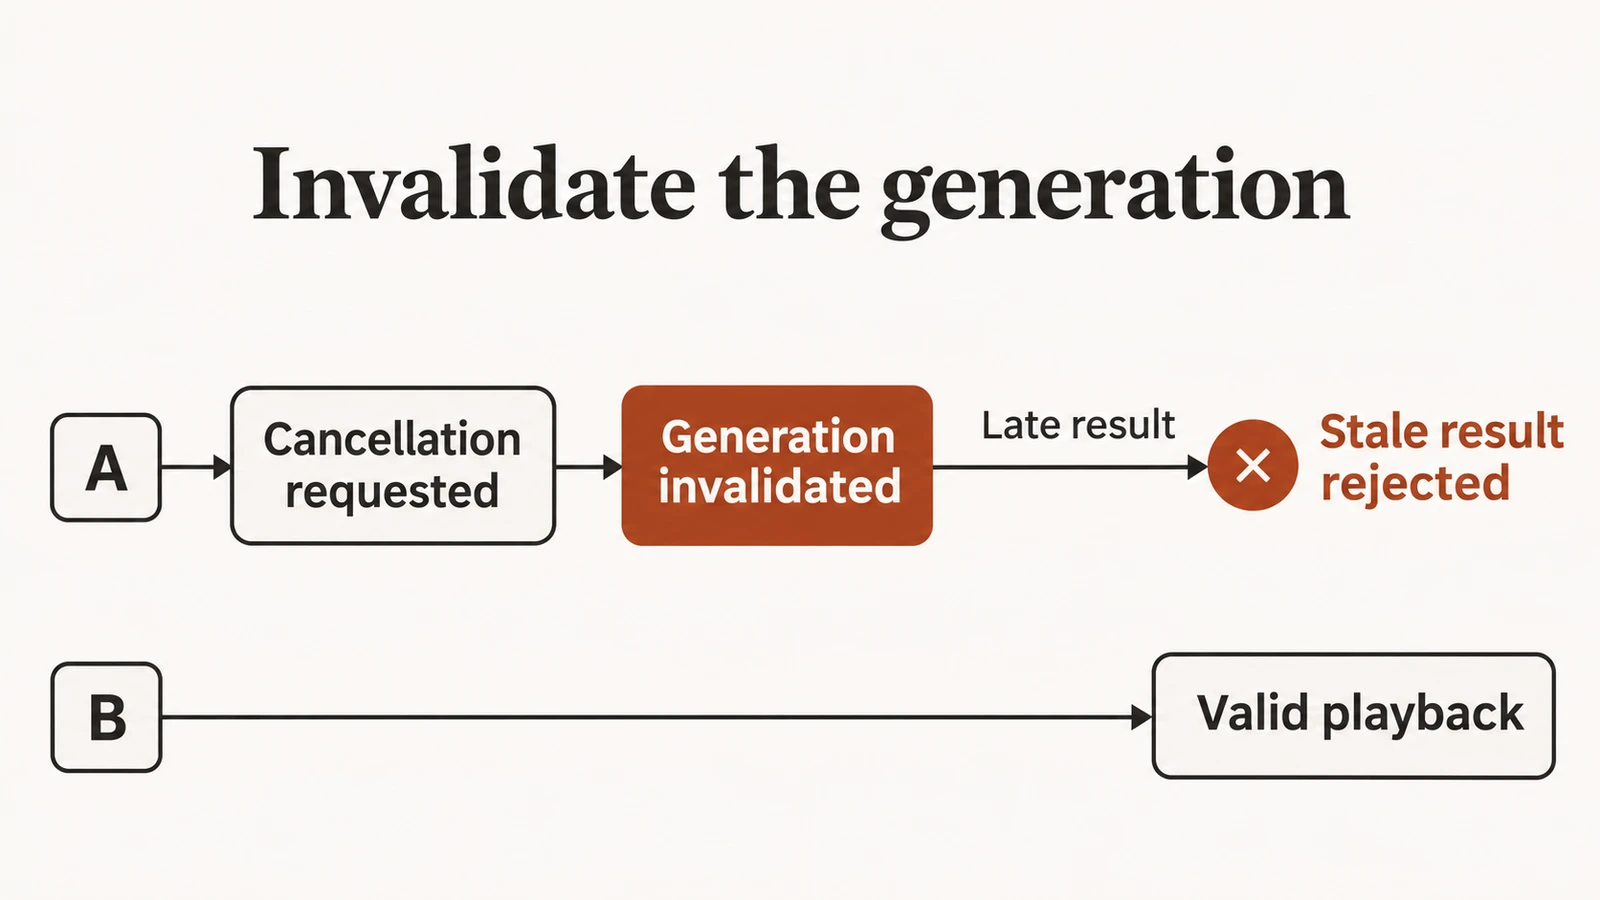
Record cancellation requested, cancellation acknowledged where available, and output invalidated. The first event describes intent; the last describes the state that prevents stale audio from becoming audible.
A provider may finish work after cancellation. That outcome can be operationally normal, but the application must still reject the stale result and include any chargeable work in its usage accounting.
Use the interruption state machine to define which component owns generation validity. Telemetry should observe the invariant, rather than becoming a second controller that tries to enforce it after the fact.
A useful invariant is that no playback segment starts after its generation has been invalidated. That invariant is testable with metadata and does not require retaining the words in the segment.
Trace tools without copying their payloads
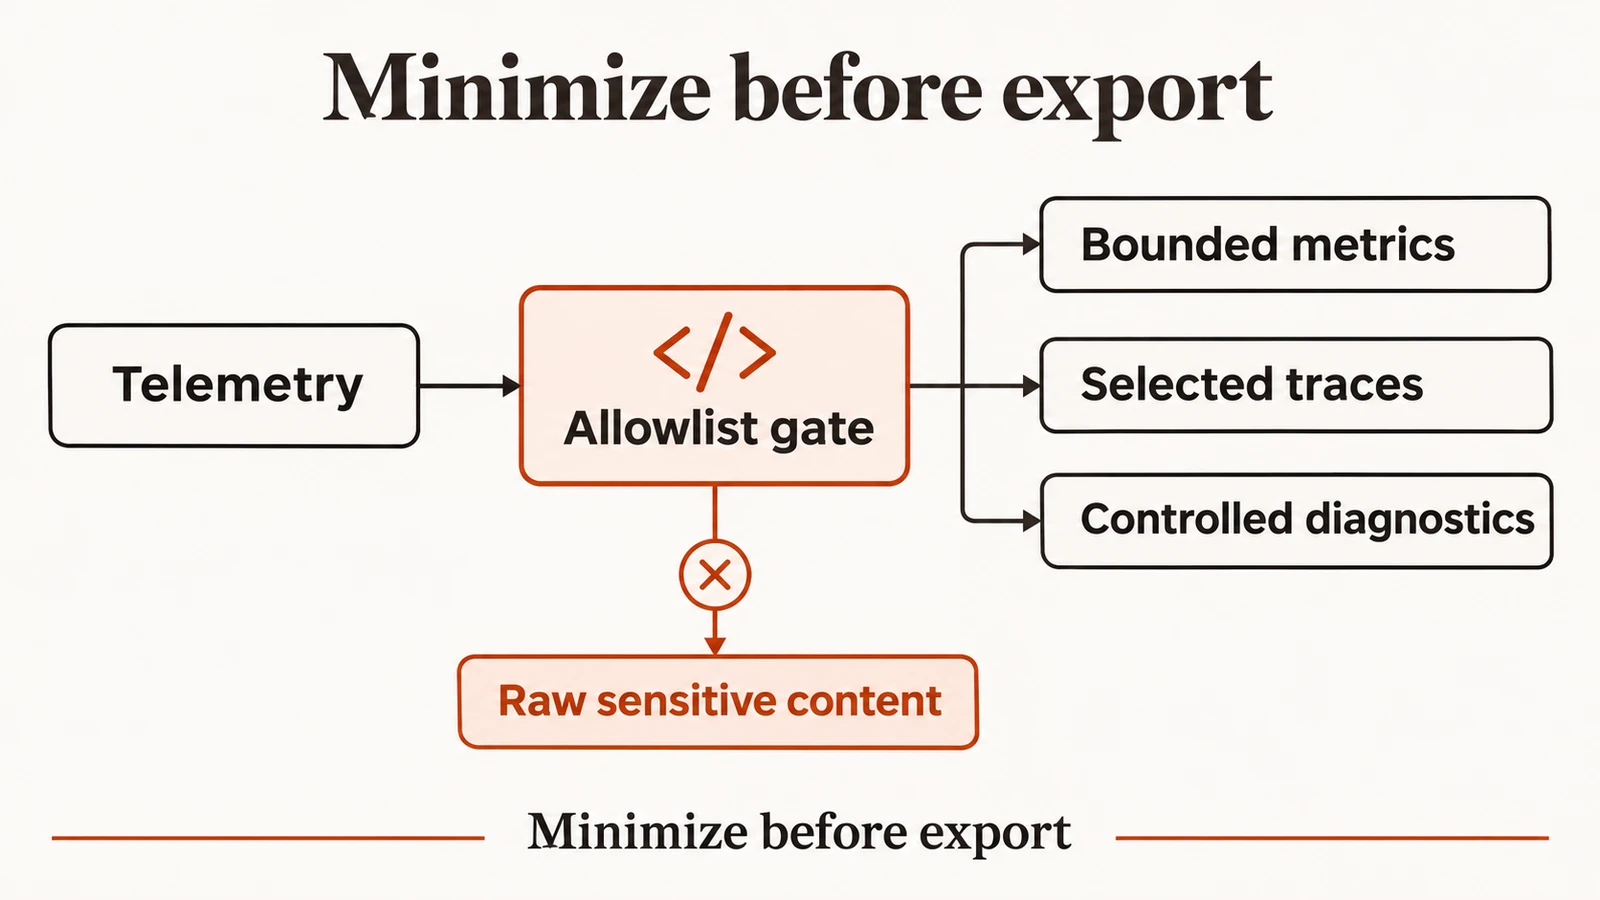
Record bounded tool names, operation class, validation outcome, authorization outcome, attempt count, duration, and business receipt state. Keep argument bodies and returned records outside default spans.
An error code can also contain sensitive content. Some backends embed user-supplied text in exceptions, URLs, or validation messages, so a field named error is not automatically safe to export.
Use allowlisted categories for routine analytics. An authorized investigation can access a separately controlled diagnostic record when necessary, but broad dashboards should not become a searchable archive of tool responses.
Workflow enforcement matters because a successful tool request and an authorized business action are distinct facts. A trace should expose which check passed and which system confirmed the result.
Trace transfer and post-call work
A transfer can create another call leg, a bridge, or an external handoff. Preserve relationships between legs and the business task, while keeping each leg's transport status and cost separately identifiable.
A handoff request is not proof that a human accepted the call. Record requested, destination reached, accepted when observable, failed, and caller disconnected as separate states.
The warm handoff guide explains the operational contract. Your trace must stop short of claiming context preservation or human acceptance when the integration only emits a transfer request.
Post-call work needs its own lifecycle, too. A recording-ready event can arrive after call completion, so shutdown semantics should preserve that work without keeping the media session open.
Debug failures through causal evidence
Choose one failed turn and write the expected path before opening every dashboard. The expected path makes missing or contradictory evidence visible and prevents a broad search from turning into a collection of unrelated anomalies.
For a slow answer, begin with the audible symptom. Establish whether input reached the system, whether an endpoint was accepted, whether a response was requested, and whether audio reached the playback boundary.
Move upstream only when the current boundary has evidence. If there is no input audio, analyzing model token timing cannot explain the failure; if playback never started, a fast synthesis request cannot clear the output path.
Diagnose a long pause
An illustrative trace shows endpoint acceptance followed by a tool request and then no response audio. The tool span ends in a timeout, while the response attempt remains open until the call closes.
The likely fault is an unhandled tool-timeout transition. Confirm it by checking the workflow's permitted fallback and replaying the same synthetic timeout, rather than merely increasing the tool timeout to hide the missing branch.
A second illustrative trace shows audio sent promptly but a growing client playback queue. The investigation belongs in decode, buffering, scheduling, or device output; replacing the language model would not address the observed critical path.
These scenarios are debugging examples, not customer incidents. Their value is the method: identify the last confirmed boundary and test the next transition under controlled conditions.
Diagnose speech after an interruption
Find the interruption decision, the invalidated generation, and every later playback-start event. If stale audio starts afterward, inspect the ownership check at the playback boundary.
If the trace shows cancellation requested but no generation invalidation, the runtime contract is incomplete. If invalidation happened but the client continued a buffer it already held, you need a client-side flush or equivalent supported control.
Do not infer which layer failed from the transcript. A transcript can contain text the caller never heard, and it can omit audio that remained queued after the model stopped generating.
The regression harness should turn that exact causal sequence into a fixture. A repaired graph in a dashboard is less useful than an assertion that stale playback cannot recur.
Diagnose apparently silent calls
First distinguish no audio packets, undecodable audio, valid digital silence, and audio generated but unheard. Those states require different evidence and should have different diagnostic labels.
Packet counters alone cannot prove speech existed. An active stream can contain silence, comfort noise, the wrong payload interpretation, or audio from a muted input.
For SIP routes, inspect negotiated media and both traffic directions through the SIP troubleshooting guide. For browser routes, confirm permission, selected device, capture state, decode, and playback restrictions at the client.
A model should enter the investigation only after the input boundary is established. Otherwise, a telephony routing defect can masquerade as recognition failure and lead to an expensive, irrelevant model migration.
Diagnose a successful call with a failed task
Follow the business operation identity into the authoritative system. A pleasant conversation and normal hangup do not establish that a booking, payment, or support escalation persisted.
Check whether the tool result represented acceptance, completion, or queued work. If the backend returned an accepted job, the final receipt may arrive later and needs a link back to the task outcome.
The outcome metrics guide separates transport completion, conversation assessment, and verified business success. That separation is the foundation of reliable cost per success, too.
Control telemetry cost and privacy
Collecting less sensitive content can improve debugging by forcing clearer event contracts. Metadata that names a boundary and reason is often more useful than a large unstructured prompt dump.
Start with an allowlist. Call lifecycle, durations, bounded state labels, opaque correlation identifiers, and explicit error categories are a reasonable initial set, subject to your actual threat model and contractual obligations.
Do not assume hashing makes an identifier anonymous. Predictable values can be guessed, and stable identifiers can still link behavior across systems; use a designed correlation mechanism with access and retention controls.
OpenTelemetry's sensitive-data guidance describes data minimization and processing controls. Apply those principles before export, because deleting a field from the final dashboard does not remove copies already sent elsewhere.
Redact at the source and verify the result
Prevent sensitive payloads from entering default instrumentation. A collector transformation is a useful second layer, especially for third-party instrumentation, but source-level avoidance reduces the number of places where content can leak.
Check URLs, query strings, exception messages, span names, and baggage. These less obvious fields can contain account references or user text even when the obvious transcript field is absent.
The Collector transformation documentation describes filtering and attribute changes. Use your installed Collector's supported processors and validate the actual configuration, rather than copying a version-dependent example into production untested.
Inject synthetic canary strings into a staging fixture and search authorized telemetry stores for them. The test should confirm that permitted correlation metadata survives while prohibited content is absent from every exported signal.
Control cardinality
Metrics labels need bounded values. A call identifier, turn identifier, full URL, or arbitrary tool error message can create a separate time series for every event and make the telemetry backend expensive or unstable.
Put high-cardinality correlation in traces and controlled logs, then use exemplars or supported links to move from a metric to a representative trace. Keep metrics dimensions to deliberate categories such as route class, task class, result, and version.
Even a bounded label can become misleading if its meaning changes. Version the definition of a failure category or preserve migration logic so a dashboard does not show a false improvement caused by relabeling old errors.
Do not collect every possible dimension because it might become useful. Add a dimension when it answers a recurring diagnostic or product question and when its privacy and storage cost are understood.
Sample without hiding the failures
Head sampling decides early, before the full outcome is known. Tail sampling can retain traces based on later properties, but it needs buffering and enough time to observe the relevant terminal state.
OpenTelemetry's sampling concepts explain those approaches. For long voice calls, the practical design must also handle disconnects, missing terminal events, and post-call outcomes that arrive after the sampling decision.
Retain a known baseline sample alongside failure-focused traces. A store containing mostly failures cannot estimate production failure rates without the sampling policy and denominators.
Track dropped spans, exporter backpressure, and collector failures. Missing telemetry during peak load can make the system look healthy precisely when it is failing, so observability needs its own health signals.
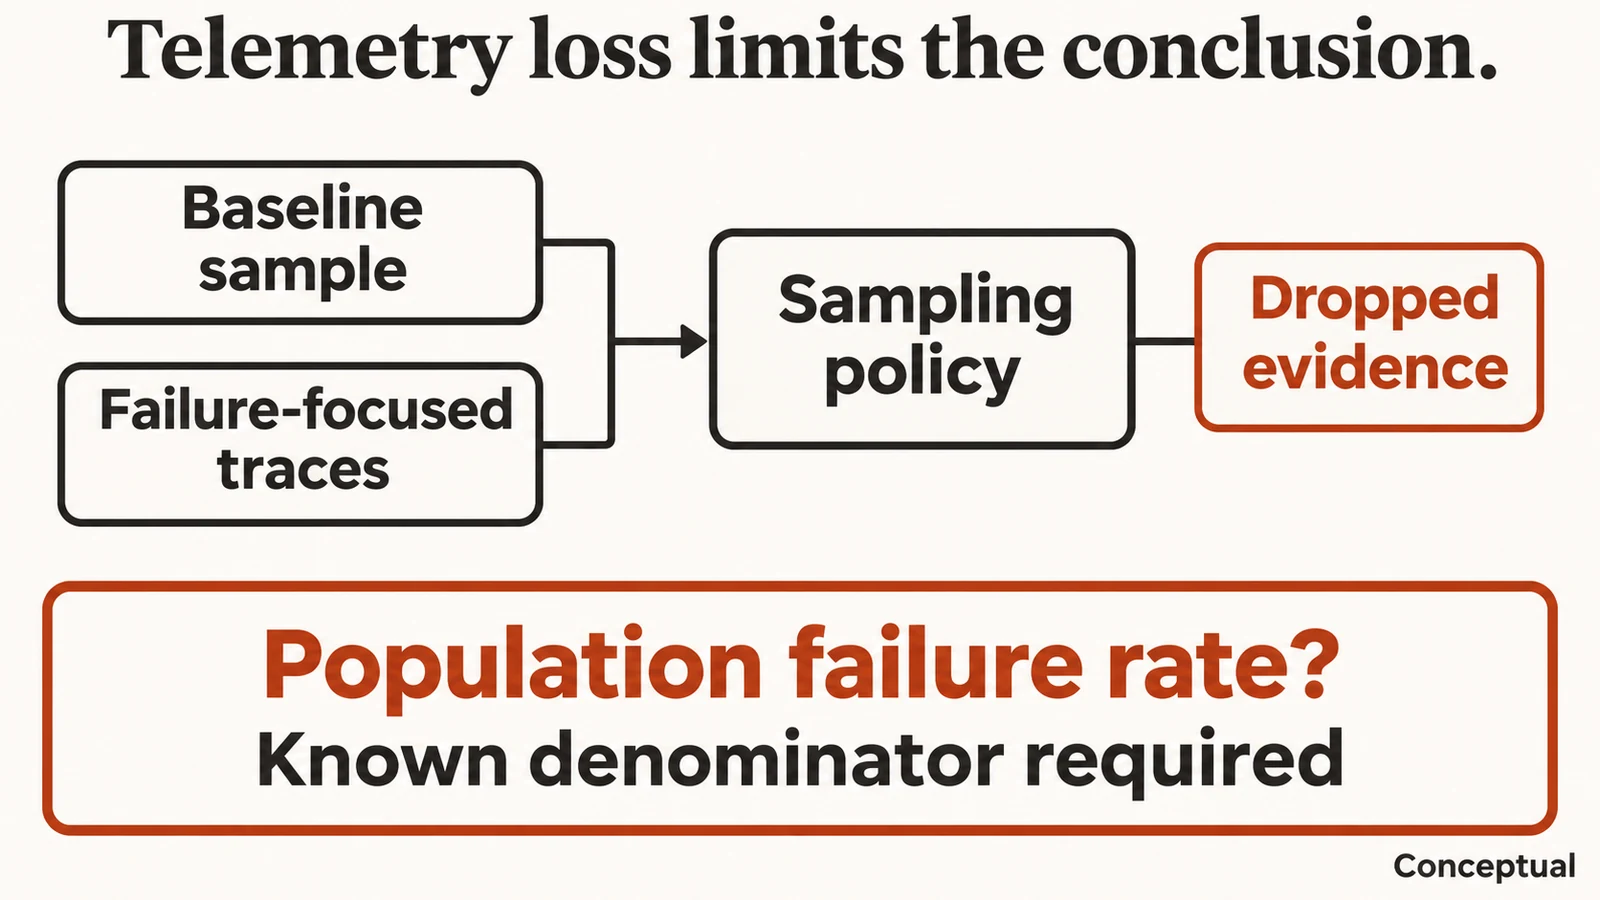
Failure-focused traces explain incidents; population rates still require known denominators and sampling policy.
Connect traces to outcomes
A trace explains a path, while an outcome record states what the business system ultimately verified. Join them through a task identity whose scope is narrow enough to avoid unnecessary cross-customer linkage.
Keep outcome states explicit: confirmed success, confirmed failure, pending, and unknown. A missing receipt is unknown until you have evidence of failure or success.
Store the time at which an outcome became known, as well as the call's end time. That supports delayed attribution and prevents a call from changing historical dashboards silently after a backend job settles.
The cost-per-success method uses that same boundary. Without it, a team can lower apparent costs by counting every connected call as a success while ignoring failed commitments and repeat attempts.
Use product analytics at their documented scope
60db Agent documentation describes call analytics for outbound and stream calls, with additional quality analysis dependent on recording. Stream calls lack telephony line-quality evidence, so a missing field should not be read as perfect network quality.
These surfaces can support investigation, but they are not a promise of a complete low-level distributed trace. Treat provider analytics as one evidence source and instrument the application and business boundaries you own.
Signed events and tool logs provide further integration evidence under their documented contracts. They still need deduplication, authorization checks, and clear separation between event receipt and the business fact the event describes.
The series has no observed production cohort proving an observability improvement. The proposed design makes failures explainable; a later empirical report should measure detection, diagnosis, and recovery under a stated protocol.
Design alerts around action
An alert should identify a failure mode, a cohort, and the evidence needed for the next action. A generic alert that voice quality fell gives an operator no clear starting point.
Separate inability to establish media, slow response, repeated cancellation, tool failure, and missing business receipts. Each has a different owner and a different safe mitigation.
Thresholds need a baseline and enough traffic to support a rate. For low-volume cohorts, an individual severe failure or synthetic check can be more actionable than an unstable percentile computed from a handful of calls.
Record the chosen mitigation in operational notes. Rolling back a prompt will not repair a carrier outage, and disabling a tool can prevent damage while leaving the conversation path available for safe fallback.
Keep operator views useful
A call view should show the timeline, terminal reasons, missing boundaries, version metadata, and links to authorized evidence. It should not default to exposing all caller content to anyone who can view service health.
A turn view should separate user speech, endpoint policy, response attempts, tools, audio delivery, and playback. Canceled or speculative operations need visible labels so operators can understand why work exists without corresponding audible output.
A cohort view should show denominators, unknown outcomes, sampling policy, and missing telemetry. Those details prevent a clean chart from implying stronger evidence than the underlying collection supports.
Validate the instrumentation
Instrumentation is software and can be wrong. Validate it with deterministic fixtures before trusting a dashboard to decide whether another system is wrong.
Create a synthetic sequence with a known endpoint, delayed tool result, cancellation, stale response completion, and post-call receipt. Verify every expected event appears and every causal identifier joins correctly.
Use the existing regression harness rather than building another test runner. The assertions should cover event semantics and ownership, not merely that an exporter accepted JSON.
Add structural assertions
Every response attempt should have a terminal reason, every tool attempt should point to an operation, and every playback start should point to a valid generation. A call that closes with open operations should produce an explicit incomplete-state diagnostic.
Allow legitimate exceptions through named states. A provider crash can prevent a terminal event, but the trace should show that the state is unresolved instead of silently inventing a normal completion.
Test duplicate and out-of-order delivery. Webhooks and telemetry exporters have distinct contracts, so your ingestion layer needs idempotent handling based on the documented identity available at each boundary.
Check the failure path when export is unavailable. Telemetry should not block real-time audio indefinitely or cause business writes to retry unpredictably because an analytics endpoint is down.
Validate timing and privacy together
Run a local fixture with known monotonic intervals, then compare derived durations with the fixture's expected values. Keep the tolerance tied to the test's scheduling and measurement method rather than requiring false nanosecond precision.
Verify that cross-clock subtraction is rejected unless the measurement declares its synchronization method. A correct failure is better than a beautifully rendered but physically impossible waterfall.
Run the synthetic canary privacy test after instrumentation-library updates. New automatic attributes or exception capture can change exported content even when your own event schema remains unchanged.
Finally, review a trace from the operator's point of view. If the evidence cannot answer which boundary failed and what to check next, add the missing observation instead of adding another generic dashboard panel.
Frequently asked questions
What is voice-agent observability?
Voice-agent observability connects media, conversational state, external tools, and verified outcomes through inspectable evidence. It includes metrics and traces, but useful coverage depends on the boundaries your integration can actually observe.
Is a transcript enough to debug a call?
A transcript helps inspect language content but usually omits media timing, cancellation, buffering, and transport behavior. Use it as a controlled evidence source alongside metadata rather than treating it as a complete execution record.
What should one trace represent?
A call trace can connect the session's related operations, with spans or linked traces for turns and asynchronous work. Preserve separate identities for response attempts, tool operations, media legs, and business tasks.
Which timestamp should measure durations?
Use a monotonic clock within one process or a documented synchronization method across systems. Keep wall-clock timestamps for correlation and record whether each event time describes occurrence, observation, or ingestion.
Why can a fast model still feel slow?
Endpointing, tools, transport, decode, and playback can dominate the caller's wait. A model-request duration describes only one interval and cannot establish end-to-end audible latency.
Should I add every span duration?
Streaming operations often overlap, so adding all span durations overstates the critical path. Follow causal dependencies and compute the interval between the actual start and end boundaries you intend to measure.
How do I trace interruptions?
Record the interruption decision, cancellation request, invalidated generation, and subsequent playback events. The critical invariant is that stale audio cannot start after its generation becomes invalid.
How do I trace a tool retry?
Keep one business-operation identity and a distinct identity for each delivery attempt. Preserve idempotency evidence and the authoritative receipt so a timeout cannot be mistaken for proof that no write occurred.
Should tool arguments go into spans?
Default to bounded metadata about validation, authorization, duration, and result state. Tool arguments and returned records can contain sensitive information and belong only in separately authorized diagnostic storage when needed.
What is trace-context propagation?
Trace-context propagation carries tracing identity across service boundaries using a supported standard such as W3C Trace Context. Use existing libraries and validate external input rather than inventing a new header format.
Can a recording prove what the caller heard?
A recording proves audio at its capture boundary. It may not reflect client buffering, device output, or a later media failure, so document where it was captured before drawing playback conclusions.
How should I sample long calls?
Choose a policy that preserves a known baseline and the failure cases you need to investigate. Record the sampling decision and monitor dropped telemetry, especially when the system is under load.
Why avoid call IDs in metric labels?
A unique call ID creates high-cardinality time series and can overwhelm the metric backend. Keep correlation in traces or controlled logs while metrics use bounded dimensions.
Is hashing personal data enough?
Hashing does not automatically remove identifiability or linkage risk. Minimize collected data and use explicit access, retention, and correlation controls designed for the actual threat model.
What does a completed call establish?
A transport-level completion establishes the provider's documented call state. It does not prove that the caller understood the answer or that a business action persisted.
Can provider analytics replace application tracing?
Provider analytics explain the boundaries the provider documents and exposes. Your application still owns client playback, backend authorization, and authoritative business outcomes outside that provider's view.
Does quality analysis require recording?
For 60db Agent, documented quality analysis depends on recording while call analytics has a different scope. Verify the current workspace contract and avoid assuming every metric has the same collection requirement.
What should happen when export fails?
The audio path should retain bounded behavior and avoid indefinite blocking on telemetry. Surface exporter failures separately and preserve an explicit account of lost evidence.
How do I test trace privacy?
Inject synthetic canary content into a staging fixture and inspect authorized exports for leakage. Check logs, metrics, spans, URLs, errors, and baggage rather than searching only the obvious transcript field.
What is the smallest useful first step?
Instrument one complete turn with call, turn, response, tool, and playback identities. Add explicit terminal reasons and clock domains, then replay a controlled failure to verify the trace explains it.
Build one trace you can trust
A useful trace makes a failed turn explainable without implying more visibility than the system has. It connects operations through stable identities and keeps observed facts separate from inferred outcomes.
Start with one supported route and one workflow. Trace endpoint acceptance, response attempts, tool commitment, audio delivery, and playback where observable, then add explicit unknown states for the boundaries the provider does not expose.
Validate cancellation, duplicate delivery, export failure, and privacy with synthetic fixtures. Keep the resulting metadata small enough that operators can find the last confirmed boundary quickly and act on the right component.
For 60db Agent, begin with documented analytics and events where enabled, then connect your own application and business-system evidence. The first milestone is one trustworthy trace that explains a controlled failure, followed by a regression assertion that proves the repair.